
Your chart.
A second set of eyes.
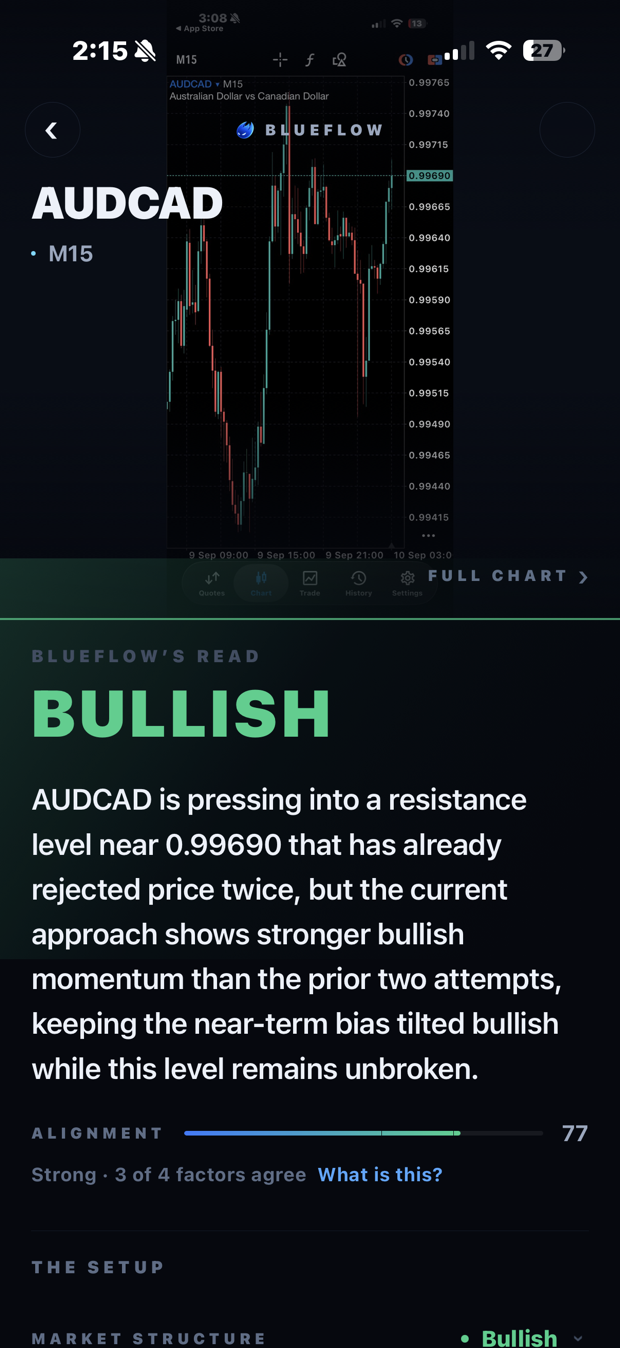
Screenshot any chart — TradingView, MetaTrader, your broker, an exchange app — and BlueFlow returns a structured technical read of what is actually on it: bias, market structure, the levels that matter, both scenarios, and the thing that would prove it wrong.
How it works
Three taps, about twenty seconds.
No account linking, no API keys, no broker connection. BlueFlow never touches your positions — it reads a picture, and only that picture.
STEP 01
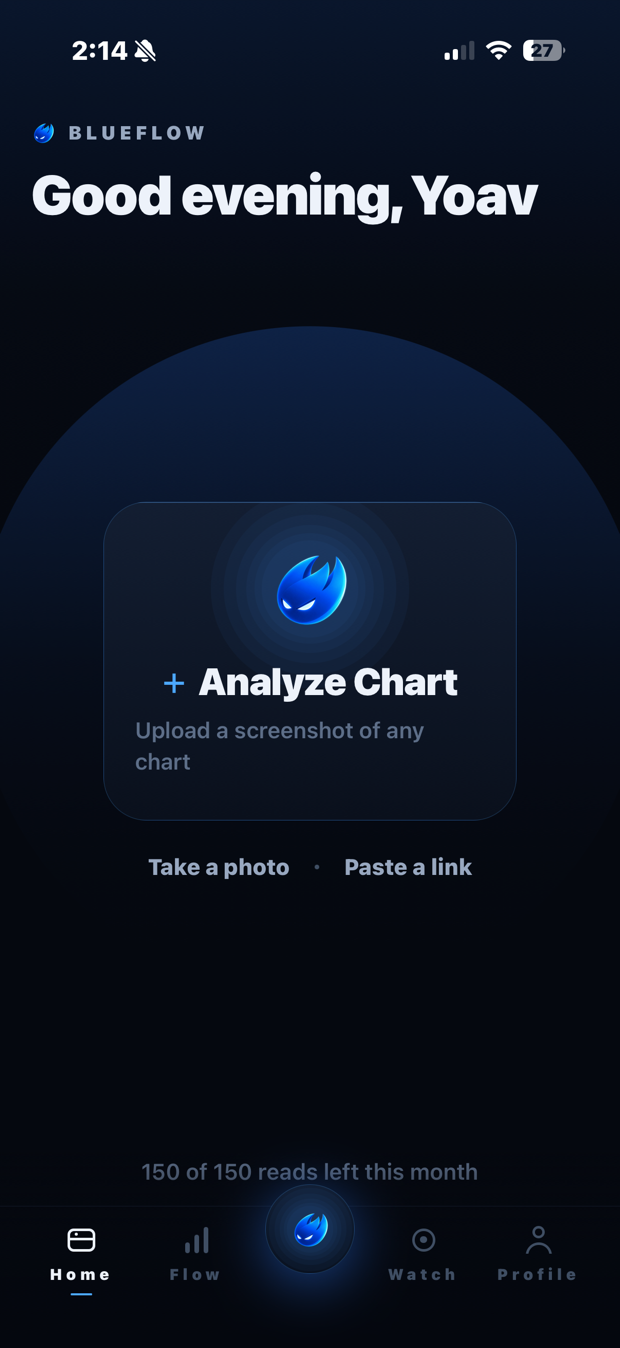
Send it a chart
Screenshot from any platform and pick it from your library, or photograph a chart on another screen. Nothing else to set up.
STEP 02
Choose how to read it
Quick for the fast technical picture. Setup when you have an idea in mind and want it judged in detail against the setup you name.
STEP 03
Get the evidence
A written read with the reasoning behind it: structure, momentum, volume, levels, both scenarios, and the invalidation.
The read
An answer you can argue with.
Most tools hand you a verdict. BlueFlow hands you the reasoning underneath it, so you can check the reading against your own chart before you do anything about it.
- A directional bias — with an alignment score derived from the individual factor readings, not asserted by the model.
- Market structure, momentum and volume — each called separately, so you can see where they disagree.
- The levels that matter — support, resistance, and where price is sitting between them.
- Both scenarios — what continuation looks like, and what the other side looks like.
- The invalidation — the specific thing that would make the read wrong.
- "Not visible" — when the chart does not show something, BlueFlow says so instead of guessing.
“AUDCAD is pressing into a resistance level near 0.99690 that has already rejected price twice, but the current approach shows stronger bullish momentum than the prior two attempts, keeping the near-term bias tilted bullish while this level remains unbroken.”
Illustrative of the format. Not a recommendation, and not a prediction.
Yours, not generic
It reads the way you trade.
A short setup captures the markets you trade, your time horizon and how you read a chart. Every analysis is weighted to that — a swing trader on indices and a scalper on crypto do not get the same paragraph.
- Your Flow — every reading kept and searchable, threaded by instrument, so you can see how your own view of a chart has changed.
- Flow Watch — save a setup and BlueFlow holds the instrument, the levels, the invalidation and both scenarios. Each new read of that chart is measured against what you saved.
- Full history on every plan — nothing about your past reads is behind the subscription.
Read this part
What BlueFlow will never do.
A tool that oversells itself is a tool you cannot calibrate against. So, plainly:
- It will not tell you to buy or sell. BlueFlow produces no recommendations, no signals and no trade calls. Every decision is yours.
- It cannot predict price. Technical analysis is interpretation, not prediction. Two identical-looking charts are routinely followed by opposite outcomes.
- It can be wrong. Every analysis is generated by a large language model from the image you uploaded, without a person checking it first. Models misread charts. Verify anything you intend to act on, against your own chart, on your own platform.
- It sees nothing but the picture. No market data feed, no order book, no news, no fundamentals, and no knowledge of your positions, your balance or your broker. Most of what moves a price is not on the chart.
Pricing
Every feature on both plans.
Volume is the only difference. There is no locked feature list, because inventing one is a lie a trader discovers the day after paying.
Enough to see whether BlueFlow reads your charts the way you do.
- Quick and Setup reads
- Tuned to your markets and horizon
- Full analysis history, searchable
- Flow Watch
No card required.
For a trader who checks more than one chart a day. Monthly or weekly, cancel any time.
- Everything in Free
- 150 reads a month, on any mode
- Weekly or monthly billing
- Cancel any time, from your Apple ID settings
Price shown in the app in your own currency. Auto-renews until cancelled — manage or cancel any time in your Apple ID settings.
Questions
The things people ask first.
Is this financial advice?
No. BlueFlow is a software tool that describes what is visible in a chart image. It does not provide financial, investment or trading advice, it makes no personal recommendations, and nothing it produces is an offer or an inducement to deal in any instrument. We are not a broker, an adviser or a regulated financial firm. See the Terms of Service, sections 5 and 6.
Does it connect to my broker or place trades?
No, and it cannot. BlueFlow has no broker connection, no exchange connection, no API keys and no access to any account of yours. It reads an image you send it.
How accurate is it?
Every analysis is generated by a large language model, and models can misread an image, misidentify a timeframe, or state a level that is not on the chart. We design against it — the app reports what it could not read rather than guessing, computes the alignment score in our own code from the individual factor readings, and validates every response against a fixed schema before you see it — but none of that makes an output correct. Treat BlueFlow as a second opinion to be checked, never as a source of truth.
What happens to the charts I upload?
They are stored against your account so your history stays available, and they are sent to the model provider that produces the analysis. They are not used to train models and are not used for anything else. Deleting your account deletes them. The Privacy Policy sets out the detail.
How do I cancel?
Through your Apple ID settings, the same as any App Store subscription — not through us, and not by deleting the app, which does not cancel anything. Step-by-step instructions.
Which markets does it work on?
Any market with a candlestick chart: forex, crypto, indices, equities, commodities, futures. BlueFlow reads the picture, so the platform and the instrument do not matter — only whether the chart is legible.
Bring your next chart.
Free to try — 1 analysis a month, every feature included. If it does not read your charts the way you do, you have lost nothing.